Life expectancy is a measure often used to gauge the overall health of a population. As a summary measure of mortality, life expectancy represents the average number of years of life that could be expected if current death rates were to remain constant. Shifts in life expectancy are often used to describe trends in mortality. Life expectancy at birth is strongly influenced by infant and child mortality. Life expectancy later in life reflects death rates at or above a given age and is independent of the effect of mortality at younger ages.
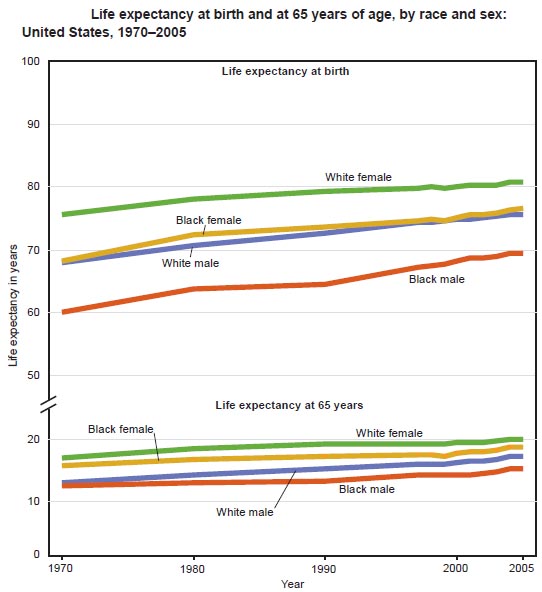
From 1900 through 2005, life expectancy at birth increased from 46 to 75 years for men and from 48 to 80 years for women. Life expectancy at age 65 also increased during this period. Among men, life expectancy at age 65 rose from 12 to 17 years and among women from 12 to 20 years from 1900 through 2005. In contrast to life expectancy at birth, which increased sharply early in the 20th century, life expectancy at age 65 improved primarily after midcentury. Improved access to health care, advances in medicine, healthier lifestyles, and better health before age 65 are factors underlying decreased death rates among older Americans.
In 2005, life expectancy at birth was 76 years for white males compared with 70 years for black males and 81 years for white females compared with 77 years for black females. Life expectancy at birth increased more for the black than for the white population between 1990 and 2005. During this period, the gap in life expectancy between white males and black males narrowed from 8 years to 6 years. During the same period, the gap in life expectancy between white females and black females decreased from 6 years to 4 years.
In 2006, life expectancy at birth for the total population reached a record high of 78.1 years, up from 75.4 years in 1990. Between 1990 and 2006, life expectancy at birth increased 3.6 years for males and 1.9 years for females. The gap in life expectancy between males and females narrowed from 7.0 years in 1990 to 5.3 years in 2006.
Between 1990 and 2006, life expectancy at birth increased more for the black than for the white population, thereby narrowing the gap in life expectancy between these two racial groups. In 1990, life expectancy at birth for the white population was 7.0 years longer than for the black population. By 2006, the difference had narrowed to 4.9 years.
Life expectancy at birth in the United States lags behind that in most other industrialized countries. Life expectancy and infant mortality are often used to gauge the overall health of a population. Life expectancy shows a long-term upward trend and infant mortality shows a long-term downward trend.
Among the 37 countries and territories that submitted data to the Organisation for Economic Co-operation and Development (OECD) in 2004, Hong Kong had the highest life expectancy at birth for men (79.0 years) and Japan for females (85.6 years). The Russian Federation had the lowest life expectancy at birth for both males (59.1 years) and females (72.4 years). In 2004, the U.S. ranked 23rd in life expectancy at birth for males and 25th for females.
Rising Life Expectancy: A Global History
Life Expectancies: Monologues That Challenge
In 2005, age-adjusted death rates for the black population exceeded those for the white population by 46% for stroke (cerebrovascular disease), 31% for heart disease, 22% for cancer (malignant neoplasms), 108% for diabetes, and 782% for HIV disease.
In 2006, the infant mortality rate was 6.71 infant deaths per 1,000 live births, 27% lower than in 1990. Large disparities in infant mortality rates among racial and ethnic groups continue to exist. In 2005, infant mortality rates were highest for infants of non-Hispanic black mothers (13.6 deaths per 1,000 live births), American Indian mothers (8.1 per 1,000) and Puerto Rican mothers (8.3 per 1,000); and lowest for infants of Cuban (4.4 per 1,000), Central and South American (4.7 per 1,000 live births) and Asian or Pacific Islander mothers (4.9 per 1,000).

The leading cause of death differs by age group. In 2006, the leading cause of death was congenital malformations for infants, unintentional injuries for people age 1–44 years, cancer for adults age 45–64 years, and heart disease for adults age 65 years and over. Age-adjusted mortality from heart disease, the leading cause of death overall, declined 38% between 1990 and 2006, continuing a long-term downward trend. Age-adjusted mortality from cancer (malignant neoplasms), the second leading cause of death overall, decreased 16% between 1990 and 2006. The age-adjusted death rate for motor vehicle-related injuries has remained stable since the early 1990s following a period of decline. Death rates for motor vehicle-related injuries are higher at age 15–24 years and 75 years and over than at other ages. The age-adjusted death rate for HIV disease has declined slowly since 1999, after a sharp decrease during the late 1990s. The death rate for HIV disease is higher at age 35–54 years than at other ages.
 |
 |
The homicide rate for black males 15–24 years of age decreased sharply from the early to the late 1990s and has remained relatively stable since then. Homicide continues to be the leading cause of death for young black males 15–34 years of age.
The suicide rate for non-Hispanic white men 65 years of age and over is higher than in other groups. In 2005, the suicide rate for older non-Hispanic white men was about 2 to 3 times the rate for older men in other race or ethnicity groups and nearly 8 times the rate for older non-Hispanic white women.

The population age 65 and over is increasing at a faster rate than the total population.
From 1950 to 2006, the total resident population of the United States increased from 151 to 299 million persons, representing an average annual growth rate of 1.2%. During the same period, the population 65–74 years of age grew, on average, 1.5% per year, increasing from 8 to 19 million persons. The population 75 years of age and over grew the fastest (on average, 2.8% per year), increasing from 4 to 18 million persons.
By 2029, all of the baby boomers (those born in the post World War II period 1946–1964) will be age 65 years and over. As a result, the population age 65–74 years will increase from 6% to 10% of the total population between 2006 and 2030. As the baby boomers age, the population 75 years of age and over will rise from 6% in 2006 to 9% of the population by 2030 and continue to grow to 12% in 2050. By 2040, the population age 75 years and over will exceed the population 65–74 years of age.